
Pool Corporation "Undisputed Industry Leader"
New Position

Business Overview
Name - Pool Corporation
Ticker - POOL
Market cap - £8.8Bn
Industry - Distribution
LTM Revenue - £5.29Bn
LTM EBIT - £588.8m
LTM Net Income - £412m
A) Business
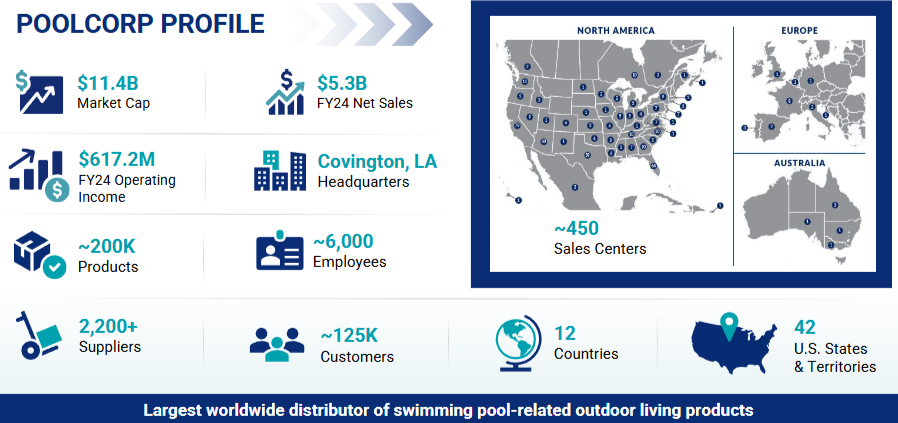
POOLCORP was founded in 1993, is the worlds largest wholesale distributor of swimming pool and related outdoor living products. Since its IPO in October 1995, the company has achieved an annual shareholder returns of 29% through market share gains, strategic acquisitions and excellent operating execution.
The company operates through 455 sales centres through five primary distribution networks 1) SCP Distributors LLC 2) Superior Pool Products LLC 3) Horizon Distributors Inc. 4) National Pool Tile 5) Sun Wholesale Supply in North America, Europe and Australia and distributes more than 200,000 products from over 2,200 vendors to roughly 125,000 wholesale customers. No other competitor can match POOLCORPS broad offering and price competitiveness.
Through their comprehensive selection of products POOL 0.00%↑ sells;
Maintenance products - Water chemicals, everyday supplies and repair parts.
Pool construction and renovation - Pool pumps, filters, heaters and cleaners, pool surfacing materials, pool tile, coping, deck equipment, pool control systems and lighting.
Irrigation and Landscape - Commercial and residential irrigation products, landscape maintenance.
Outdoor living - Outdoor lighting, grills, outdoor kitchen components and hardscape products.
In a nutshell POOLCORP generates the majority of its revenues by selling pool supplies and equipment to small, independent pool service professionals. With 125,000 customers, most of which are small, family-owned businesses provide labour and technical services to the end consumers and operate as independent contractors and specialty retailers employing few if any employees. These customers choose to partner with POOLCORP due to their broad offering, convenient local sales centres for quick parts and supplies and their integrated tech platforms POOL360 - more on this later.
The majority of POOLCORPS revenues are generated in the United States which accounted for 93% of total sales in 2024 with Europe, Canada and Other accounting for 4% and 3%. Of these sales, 65% where from non-discretionary purchases from everyday maintenance products and repair. New pool construction are growth drivers as the more pools installed the more pools that need maintaining. These revenues are stable through economic cycles and offer the company and investors predictable revenue streams. Chemical sales are the major player here with 14% of total sales in 2024. Without these chemicals, pool water quickly becomes a health hazard, allowing dangerous bacteria and algae to thrive, leading to infections and making the water cloudy and unpleasant. Proper chemical maintenance ensures a consistently clean, safe, and comfortable swimming experience.
Renovation and remodel accounted for 22%. Here, growth drivers include steady house price increases, low interest rates, aging installed base which increases the need for remodels to more energy efficient and more aesthetic pools. This category is affected by higher interest rates.
Their main discretionary segment of their business is new pool construction. Sales here will fluctuate depending on the financial health of the end consumer. High interest rates increase the cost of consumer financing for large purchases like new pools or major renovations. Here, POOL 0.00%↑ competes with other large ticket discretionary items that might not be in the pool industry. In 2024 this segment accounted for 14% of total sales. A large drop from the high demand during the pandemic when many people were investing in the homes.
A look into the business profile.
B) Industry
Pool Corp estimates its Total Addressable Market (TAM) at approximately $37 billion, broken down into roughly $14.4 billion for pools, $19 billion for irrigation and landscaping, and $3.6 billion internationally. Their industry is highly fragmented with many small players which gives them opportunities to acquire and consolidate. Since 2006 alone, $POOL has acquired more than 100 sales centres in over 40 different acquisitions.
With an approx. 40-50% market share and growing in pool supplies, POOLCORP is the undisputed leader in the industry with a 4x multiple of centres over its next competitor Heritage Pool Supply Group which operates 115 sales centres in 32 states. Remaining competitors include E-Commerce and other high ticket discretionary items such as boats, motorhomes and interior renovations.
POOLCORPS scale provides significant advantages in purchasing power and distribution efficiency. This lowers prices to its customers and allows for immediate product availability that small professional contractors rely on and beating off competitors.
The downside in the industry is the the inherent cyclicality to its remodel and new construction segments. Although roughly 65% of sales are recurring from general maintenance products, the remaining is tied to the housing market, interest rates, and consumer confidence, and can fluctuate with economic conditions. During the pandemic 115,000 new installed pools where constructed compared to 61,000 recorded in 2024. Something to consider.
The swimming pool industry experienced unstable growth in the years leading up to and during the pandemic-eras home improvement boom to unsustainable levels and distorting past growth rate assumptions. The expectations of the business got ahead of its fundamentals with the stock price rising to an all time high of $577 or to an earnings multiple of 47x, equivalent to an earnings yield of 2.1%.
The growth rate of the industry is expected to stabilize in upcoming years to more normal levels. The long-term growth rate is generally considered to be in the mid-single digits, around 4-6% annually, this takes into account cyclical peaks and troughs. POOLCORP believes their growth rate will be higher than the industry average driven by market share gains, new product offerings and acquisitions by an additional 2-3%. Adding the industry growth rate between 4-6%, we can assume a long term growth rate for the company between 6-9%.
C) Competitive advantages
C1) Purchasing power, broad offering and private label
POOLCORPS scale allows them to negotiate favourable pricing and early-buy incentives from its 2,200+ vendors, which it then shares with customers to ensure loyalty. Other competitors find it tough to compete with POOL in this regard. Another positive is the 200,000 products customers can choose making POOL a one stop shop for all swimming pool supplies.
POOLs private label, which accounts for roughly 15% of total revenues come with higher margins, typically 8-9%. Private label is a high priority growth engine for the company which is driven by the companies POOL360 digital platform which recommends private label chemicals to customers for their specific needs. As private label sales increase as a % of revenues, margins should typically increase.
C2) Distribution scale and proximity
Scale is mentioned again in this portion but towards a different advantage, distribution and proximity. Currently, POOL operates 455 sales centres in 42 US states. To put this into perspective, they have more sales centres than the next 60 competitors combined. Customers are highly time sensitive and with a dense network of sales centres, customers are able to conveniently pick up supplies easily without too much time lost, a convenience that smaller, more distant rivals cannot match.
C3) Integrated software (Pool360 digital platform)
POOL360 is a trusted digital platform used by 120,000 POOL 0.00%↑ customers. This proprietary digital ecosystem is designed to integrate its wholesale distribution network directly into the daily operations of pool service professionals and retailers. Customers use this platform daily for their business were they can search the full in-stock inventory, ordering, delivery, billing, payments, technician scheduling, route optimization, and digital customer communication. With these advanced tools, POOLCORP offers its customers state of the art software that helps them with their daily business operations and profitability. This creates a lock in effect where customers are reluctant to switch as the cost would be too dramatic from an operational standpoint for their business.
CA Summary
POOLCPORP is unmatched within its industry. No other competitor can offer its customers the advantages POOL can offer. These come in the form of low prices, convenience, proximity, broad product offering and their unique POOL360 digital platform which locks in customers.
D) Fundamentals
Within this section we will look into the companies historical financials and margins along with the health of its balance sheet and outlook.
D1) Sales and profitability
The 10 year chart below shows revenue, gross profit, operating income and net income. All have grown at attractive rates throughout the period, between 8-12%.
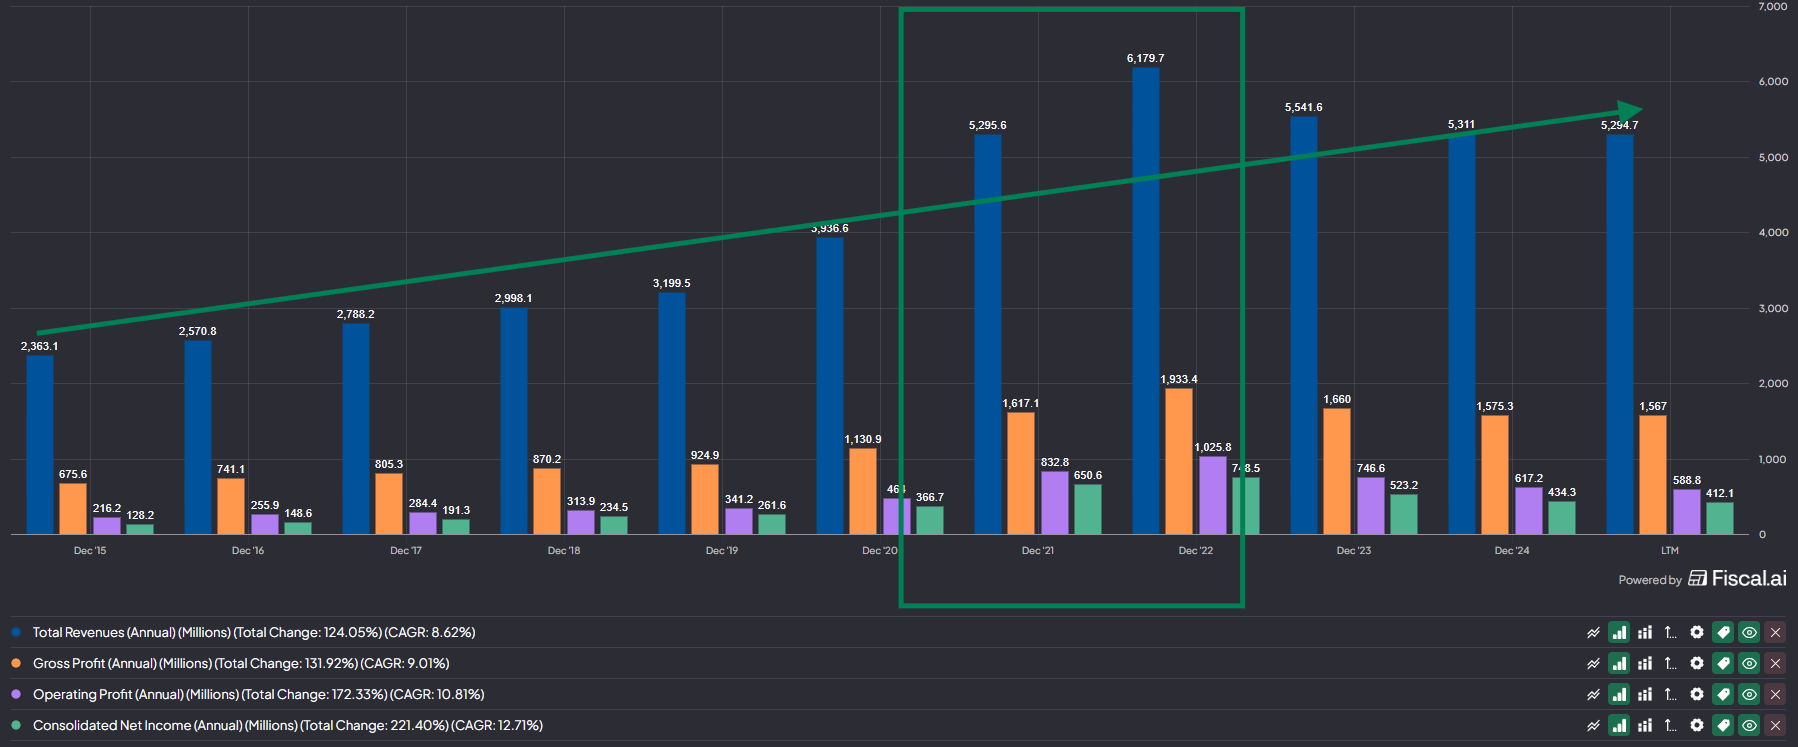
One important metric, Gross profit, is a key indicator for distributors as margins are typically low. Looking at this metric demonstrates the company's ability to maintain strong pricing power and their operational efficiency. Over time POOLCORP aims to maintain a gross profit margin >30% in the coming years which will be driven by more attractive prices from vendors as sale increase, higher margins from private label and best in class efficiency.
I’d like to give you an insight on how important 100bps of gross margin expansion has on the bottom line. Lets say POOL expands to 30.7% gross margin in the coming years (Using this margin as 2024 gross margin was 29.7%) and using 2024 financials, net income would have been in the region of $476m instead of $434m that was reported. This would also result in an EPS of $12.52 instead of $11.4. So a 100bps increase in gross margin increases EPS by 982bps or 9.82%. As you can see Net Income has the highest growth rate and this is a result of growing their gross margin.
All metrics above where positively impacted by the pandemic as end users invested in their homes. This was always unsustainable and growth was always going to slow. Looking at the past few years it looks like we are at an inflection point where growth should normalise to more industry norms. Over time, the growth rates have been very attractive. I expect growth going forward to be in the region of 6-9%.
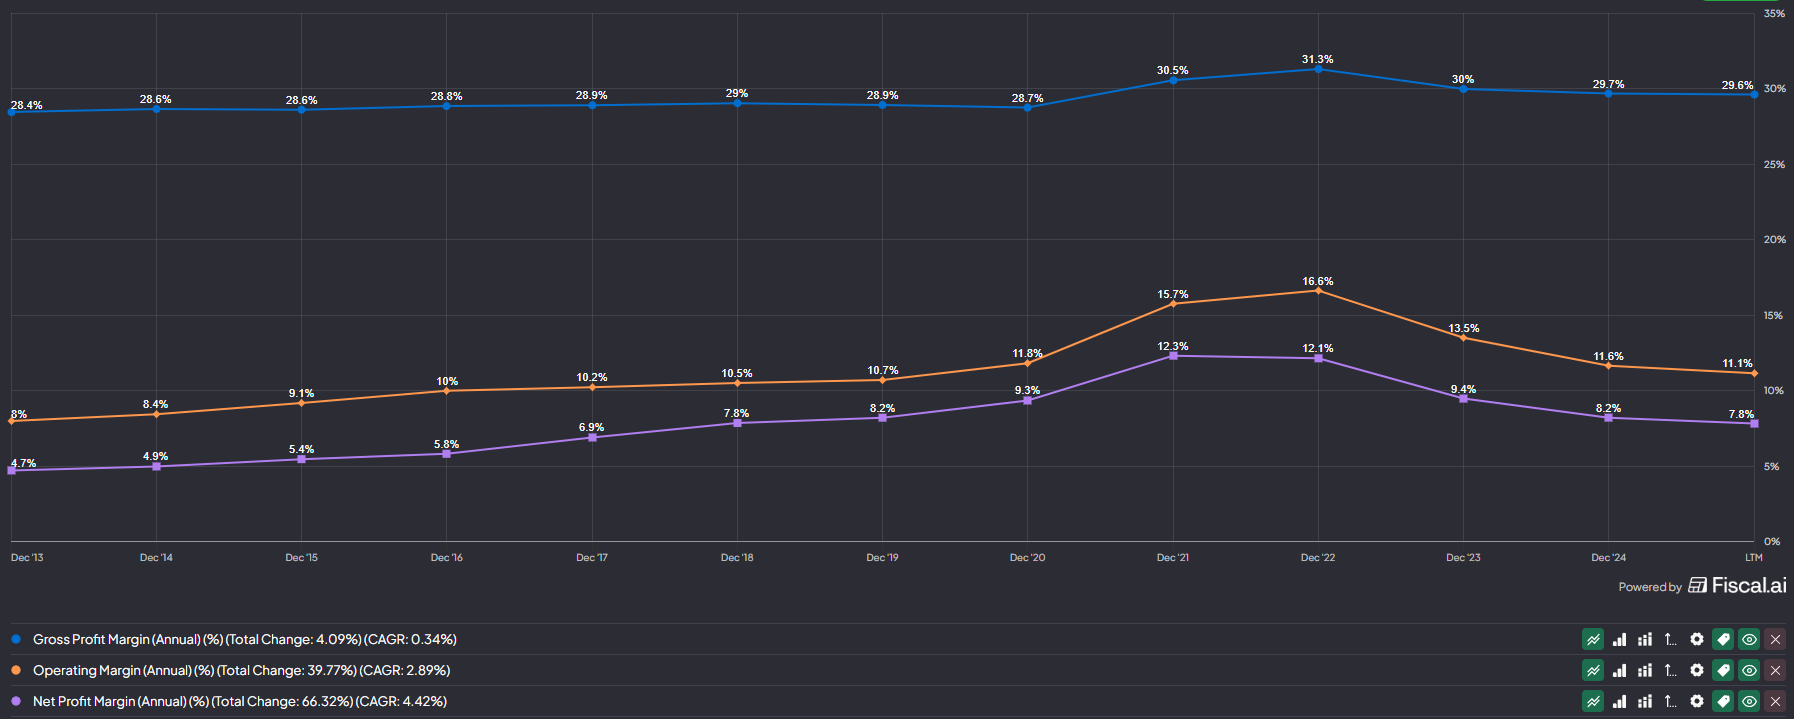
D2)Margins
POOLs margins show a steady incline over the past decade but was distorted by the pandemic. As margins have decreased since 2022 we can say margins have started to normalise. Again, showing the power of gross margin which has increased 120pbs and also their operational efficiency net income margin has increased by 310bps.
As I mentioned above, POOLCORP have a few meaningful growth drivers that should expand these margins further in the future. These are more attractive prices from vendors as scale increases and a higher % of revenues from their private label products which typically produce margins 8-9% higher than branded products. These private label sales are driven by their POOL360 software which recommends the best and most cost effective products for their customers needs, increasing their profitability and the companies.
D3)Balance sheet
Turning to the companies financial health. POOL has a fairly strong balance sheet. Below I look at Five metrics.
Cash and Cash Equivalents - Readily available cash.
Long term debt - Outstanding debt.
Current ratio - Measures a company's ability to pay off its short-term liabilities (debts and obligations due within one year) with its short-term assets (cash and assets expected to be converted into cash within one year).
Debt / Equity - Debt/Equity ratio is a primary measure of solvency risk. A higher number here typically >2x is considered highly leveraged and more at risk of insolvency.
Interest ratio - Shows if a company's earnings (EBIT) is sufficient to pay the interest on its debts.
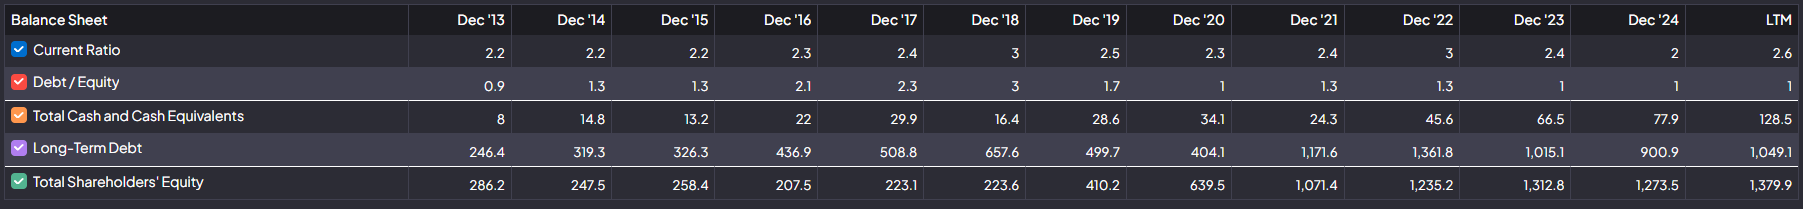
As you can see all metrics are more than satisfactory indicating a well run healthy business from a financial standpoint. Interest expense which is not included in the image above stands at 12.79x, way above what would be considered alarming. Cash and the companies current ratio are also favourable. Debt which you can see increased during 2021 which was the result of the businesses acquisition of “Porpoise Pool & Patio, Inc.” the parent company of franchise retailer Pinch A Penny and also Sun Wholesale Supply.
E) Growth
When looking into the long term growth trends of the business a few key catalysts come to mind. Consolidation through acquisition, opening new sales centres, aging pool base and investments in their digital technology (POOL360) which increases customer loyalty and efficiency.
Consolidation through acquisition - POOLCORP has been strategically acquiring smaller players in the market and consolidating the industry. Although the company isn’t highly active here, since 2020 the business has acquired 10 small bolt on deals with 1 major deal being Porpoise Pool and Patio. This is one option management has in the future to increase sales and market share.
Opening new sales centres (Organically) - This in the companies preferred method of growth. The number of new sales centres that open annually can fluctuate year to year based on market conditions. The expansion of its sales centre network enhances its market reach and service capabilities and on average POOLCORP opens between 9-14 net new stores annually. By entering new markets and territories and increasing scale the company can easily take market share from competitors through their competitive advantages mentioned above.
Aging Pool Base - As the number of installed pools start to age, older pools require more frequent and expensive equipment replacements, such as pumps and filters, which supports higher growth rates in renovation and remodel sales than new construction alone.
Investments in their digital technology - Increasing the value of what customers get through their POOL360 digital platform will increase customer engagement and in turn lock in for the long term. Investments here will increase customer loyalty, operational efficiency, increases customer reach and the businesses profitability.
The points mentioned above are marked as long term growth drivers, but what about the short term? There will become a time when interest rates decrease, customer confidence will rise and more discretionary income will be available. This turns me to new pool construction and renovations. This more cyclical segment of the business will have tailwinds in the future. When? I can’t predict that but it’s something to consider.
F) Capital Allocation
POOLCORPS capital allocation is split into growing the business organically and through strategic acquisitions, paying dividends and share repurchases.
I’ve covered their growth priorities above so ill skip it here. On to dividends. POOLCORP is an excellent option for investors who focus on dividend growth. Over the past 5 years the company has increased its dividend by a yearly average of 17%. Currently they pay out an annual dividend of $5 or $1.25 on a quarterly basis which equates to a total annual payout for the company of $184m which results in a payout ratio around 40%.
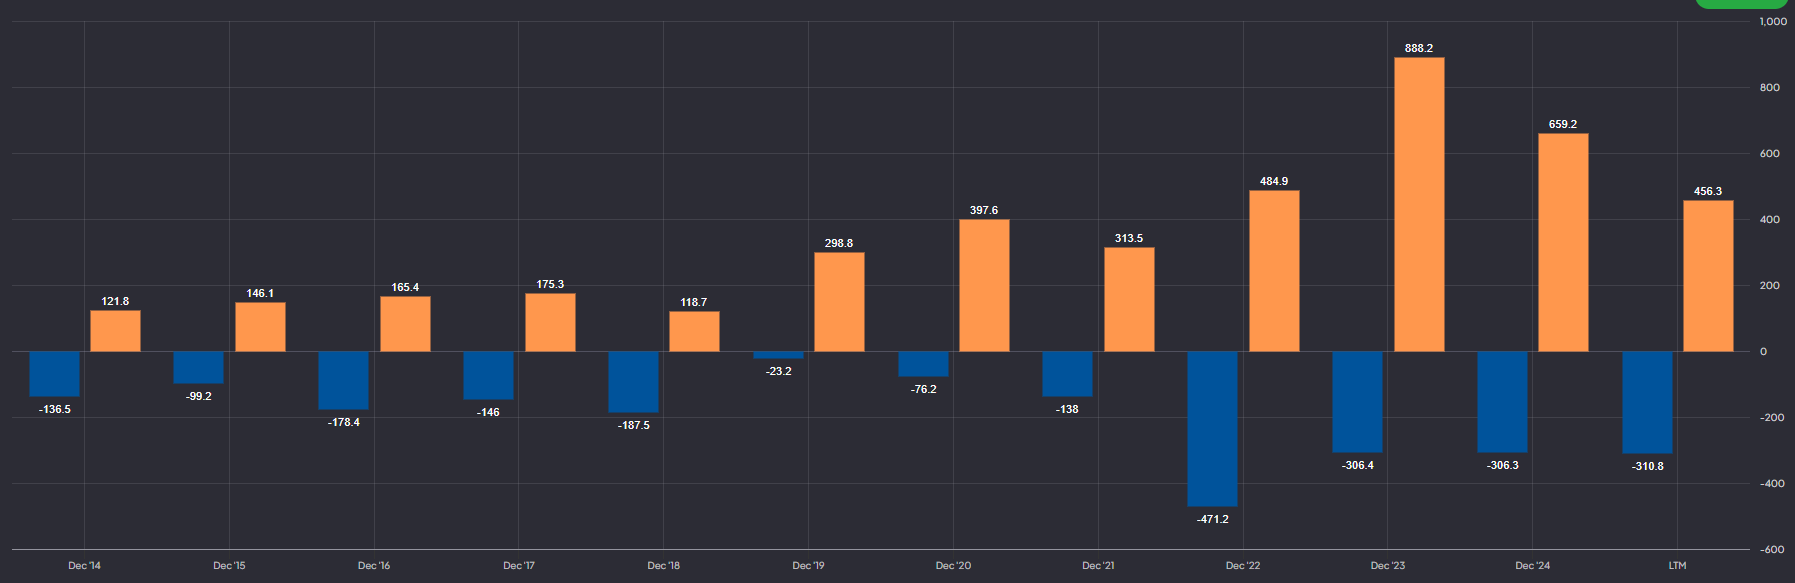
On to repurchases. This is where the majority of the left-over cash is spent. Over the last 5 years POOL has spent in the region of $300m annually on share buybacks. In the table below we can see they have constantly repurchased shares and see it as an attractive option to return cash to shareholders. I agree, but at the right price. Looking at todays price I believe they should be buying back a lot more.
Whatever is left after paying dividends and repurchases the company has the option to cash pile or pay off its outstanding debt.
G) Investment Risks
Cyclicality - Around 35% of POOLCORPS sales are tied to discretionary spending. Sales of remodels, renovations and new construction will be highly dependant on the interest rates, customer confidence and higher discretionary spending capacity.
Seasonality - POOLCORP is highly seasonal with the majority of their revenues and profitability coming in the second and third quarters. Unfavourable weather, especially during the peak swimming pool season, can significantly impact its financial results in any given year.
Decline in recurring revenues - 65% of POOLS sales are recurring through their maintenance and minor repair products. A decline as a % of total sales would indicate a less durable business and therefore could result in a company re-rating.
H) Valuation
In valuing POOLCORP I used an EPS exit multiple model. In my assumptions I have imputed the following.
Revenue growth of 7.3% (This was the companies average revenue growth before the pandemic boom, its also in the lower end of their long term guidance)
Operating margin to expand to 13.5% as they become for efficient and higher margins from private label.
Net Income to be 9.6% in the exit year driven by factors above and taking into account average taxes and interest on debt.
Reduction in share count of 1.49% per year, in line with their previous % of buybacks.
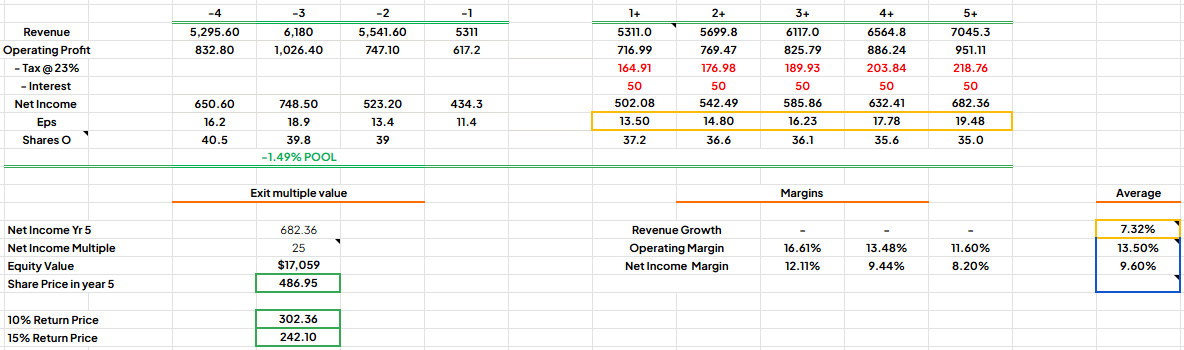
With these assumptions I have a price for POOL 0.00%↑ in the exit year of $486. On a return perspective and assuming all assumptions are correct, one would have to buy POOLCORP at $302 for a 10% return and $242 for a 15% return. These exclude returns from dividends.
Conclusion
After analysing POOLCORP its very clear they are a high quality business and an undisputed leader within their industry. Literally no other competitor comes close to the scale and customer benefits POOL 0.00%↑ offers. I can see these benefits only increasing in future years as POOLCORP continues to grow its presence in new markets which in turn will increase its bargaining power with vendors and highly likely to capture market share from other competitors.
Pursuing future growth, the company will continue its organic growth through opening new sales centres and inorganically through strategic acquisitions. Other growth drivers are also favourable including their private label offerings which are increasing as a % of sales in turn increasing profitability through higher margins (Typically 8-9%) and also the aging installed base of pools which will require upgrades to more energy efficient and aesthetic features.
POOLCORPS recurring revenues of which accounted for 65% of total sales in 2024 safeguards the company to some degree during poor economic times as these sales are non-discretionary. As more pools are installed in the coming years, this will increase the demand for more chemicals and minor repair products which should increase recurring revenues in future years.
POOLCOPRS digital platform POOL360 is a key differentiator over competitors which helps its main customers (Small business pool service professionals) streamline their daily operations by effortless online ordering, real-time inventory, delivery, billing, payments, schedule planning and routing. These tools lock-in customers and bring loyalty.
The downside to the business is its cyclical construction and renovation segment (35% of revenues 2024) which is highly tied to the health of the economy with revenues fluctuating over time.
As of this week, I sold both my positions in Dollar Tree and Dollar General after excellent returns and use the proceeds to fund a 7.7% weighting in POOL 0.00%↑ shares at a weighted average of $237.
Thank you for taking the time to read this article.
I hope you enjoyed.
DInvests
DRGInvests on X
Always do your own research 🧐
I hold a beneficial position in POOLCORP stock POOL 0.00%↑ . My buys and sells aren’t recommendations. I can’t guarantee the accuracy of the information provided in the newsletter. All statements express personal opinions and information gathered online. Any estimates, forward looking statements and assumptions made in this newsletter are unreliable. Always do your own research. Any information in this newsletter is for educational and entertainment use only and should not be taken as investment advice.